Dr Elliot Banks, Chief Product Officer, BMLL Technologies Ltd
On the 25th of June Wirecard announced it will file for insolvency following a number of accounting scandals that led to a €1.9bn hole in its finances.
Using Platometrics we track the market microstructure events that can shed light onto how the market behaved in response to announcements by Wirecard, the press and regulatory bodies.

Chronology of events
On the 16th of June, two banks in the Philippines announced Wirecard balances totalling €1.9bn were spurious. On the 18th of June, instead of publishing its annual results for 2019, Wirecard announced that €1.9bn was “missing”.
On the 18th of June, trading in the Wirecard stock jumped 10x from a long run average of 4-5m shares daily to topping 52m shares on the 18th; it subsequently fell back sharply to approx 20m shares on the 24th June, the day preceding the insolvency announcement.
Venue & EBBO Analysis
The volume executed on the Lit books (exchange liquidity with no pre-trade transparency waivers) accounted for 80% of trading volume on the 18th June. This compares to a long term average of 60% for Wirecard since the start of the year, and against a 40% average for the rest of the European market.
Examining the volumes traded on the lit vs. dark books on a stock in stressed situations can provide insight into the behaviour of major market participants. In this example, 40m shares traded on the lit book, vs. 10m in bilateral or dark books indicates that there were very few institutions willing to take the counter side to the trade. This high on-market execution put the burden of providing liquidity on the market makers, who are contracted to provide bid-offer quotes throughout the day within a given spread of the mid.
The European Best Bid Offer (EBBO), which maps the best prices and volumes across all European venues (primary and MTFs), indicates, unsurprisingly perhaps, that the majority of the volume at touch was offered with very few real money buyers in the market. As the stock price fell significantly throughout the day, the offer price remained somewhat stable, providing constant selling pressure with significant volume (Chart 2, red line). The bid prices however exhibited wild downward swings marked by very low volumes.
At 08:53 CET the best bid offer spread was 65 euros wide taking a full three minutes to return to 2 euros wide before widening again. Typical spreads for WDI (Wirecard ticker for Xetra) across Q1 were 5-10 cents wide for the months of Jan-March.

Looking deeper into the book
Using derived data metrics calculated on the full depth order book provides clearer understanding of the lasting impact on trading behaviour beyond the initial price shock. Considering first the average order size of executed orders, we see an initial jump on the 18th of June coinciding with the spike in trading volumes seen in Chart 1. However, despite total volumes ebbing back to normal, Chart 3 shows the average order size continues to increase persistently over the rest of the month, culminating in a sixfold month-on-month increase.

For interactive charts, open this page on desktop
Looking beyond the executed volumes and into the full order book, an interesting pattern emerges. While the average executed order size was similar across bids and asks, the posted volumes reveal a sharp dichotomy between the two sides of the book. There was far more activity on the bid side, perhaps as a result of short sellers seeking to cover their positions.
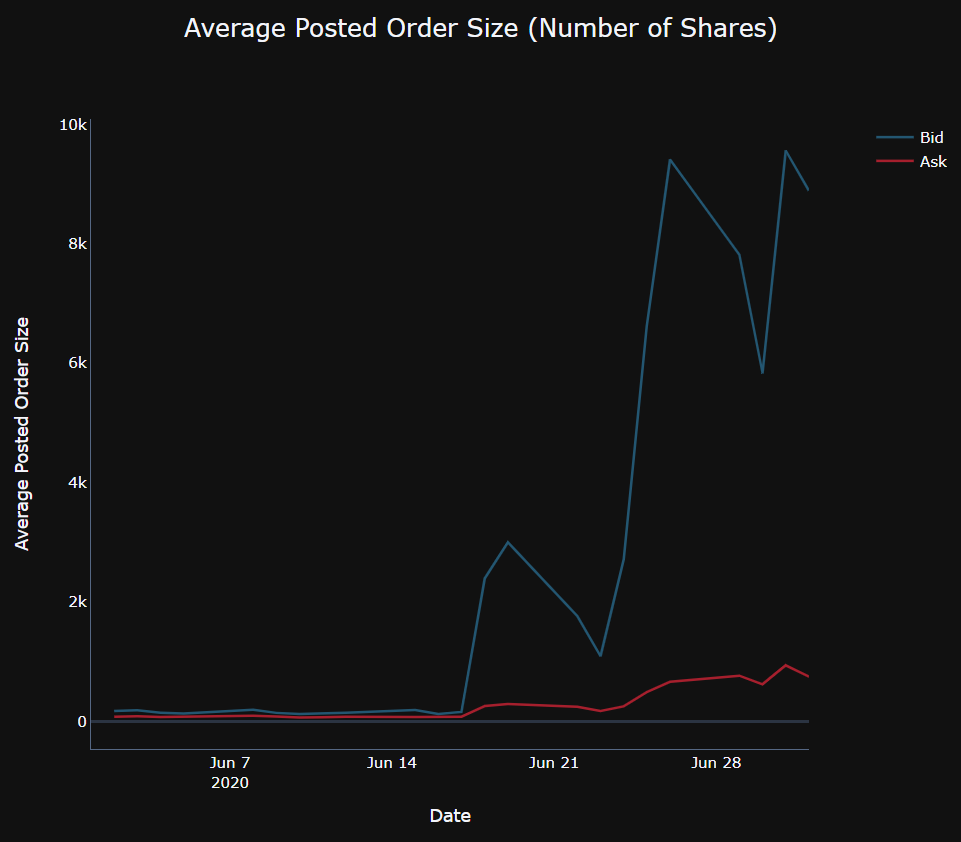
For interactive charts, open this page on desktop
The analysis so far elucidates a regime change in market behaviour, with trading becoming more aggressive in response to news of the scandal as investors rush to reposition their portfolios. This is most clearly illustrated in Chart 5, which shows the percentage of trades which are considered aggressive; this is defined as trades which take out more than one level of the book, given as a percentage of total traded volume, split out by the side of the aggressor. Again, we see a significant uptick following the initial announcement on the 18th of June, most notably on the bid side where aggressive buy trades accounted for 4.4% of daily volume compared to 1.5% the previous day. This move to aggressive trading was persistent, increasing as the extent of the fraud became more apparent; aggressive sell orders peaked at 6.2% of total trading volume on the 24th of June, the day before Wirecard announced its insolvency plans.

For interactive charts, open this page on desktop
Data & analytics like the ones shown above showcase how leveraging the full depth of the order book, in a consumable and readable format, can provide insight beyond the top of the book and can help market participants and observers understand market events during periods of stress.