Geopolitical events strain wheat futures market microstructure - taking a deeper look
First published in Tabb Forum, May 2022
Market conditions remain highly volatile. This is to be expected during such unprecedented market conditions, but different asset classes are affected in different ways. Here we examine what is happening in the order book for CME wheat futures.
Wheat futures markets trading mechanism
Ukraine and Russia are two of the world’s biggest producers of wheat, accounting for more than 30% of the global wheat production. This fact, together with ongoing supply chain constraints, are significantly affecting the wheat futures market. We observe sharp increases in prices on wheat futures, and as prices rise rapidly they have hit daily price limits quickly. Unlike in the equity market, the wheat futures market doesn’t have a circuit breaker mechanism that triggers a trading halt. Instead, trading may continue within the limit up/limit down range. This mechanism means limit order book trading may occur at prices far away from equilibrium prices.
Limit order book behaviour - liquidity air pockets
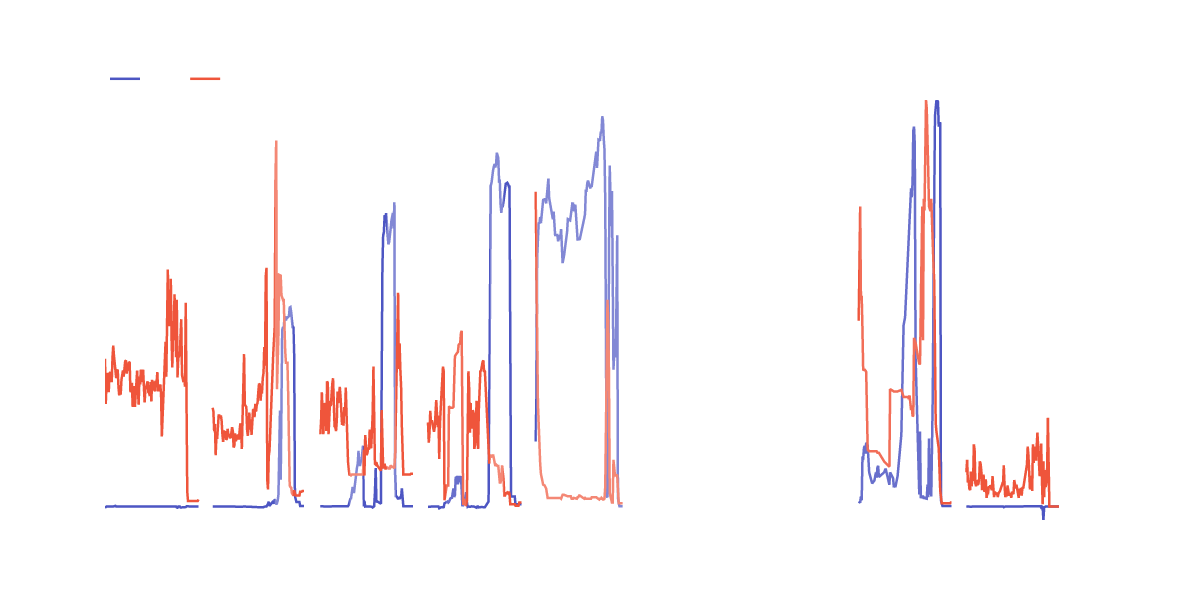
In early March this year, wheat futures prices rose until first hitting the up-limit on 1 March. Following this, large quantities of limit orders started to build significant buy pressure, with the bid peaking at over 1200 times the baseline posted liquidity. Simultaneously, the volumes of posted quotes on the ask side of the book within 100bps of mid price collapsed by over 97%. Most notably these quotes are priced away from equilibrium, which can be calculated from the options market not affected by these limits.
This market condition is similar to ‘air pockets’ where there is no liquidity resistance to price movements. Significant buying pressure and no liquidity resistance pushed the market to extreme price dislocation; prices often jumped between sessions and we see prices stepping up to the next Limit Up-Limit Down (LULD) threshold without being able to effectively form a trading price.
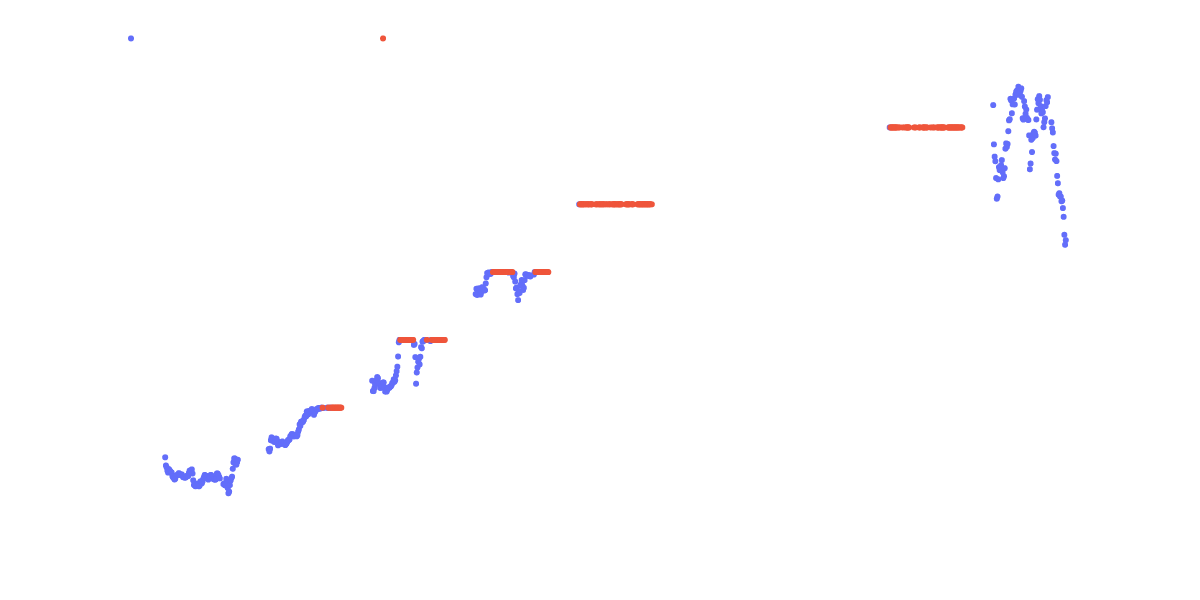
Prices on wheat futures show repeated daily price limits
The impact for market participants
The end result of these liquidity ‘air pockets’ was extended trading periods, in this case, over 8 days during which traders could not trade at fair market prices. Moreover, the price inefficiencies became more exaggerated over days as the graph below indicates. Bid-side liquidity on a limit up was around 100,000 shares on 1 March but increased to 130,000 on 2 March, 160,000 on 3 March before peaking at over 200,000 shares on 4 March. This increasing pressure from bid orders and the lack of resistance from ‘air pockets’ shortened the time to hit the daily limit significantly; on 1 March it took 13 hours, but it decreased to 6 hours and 4 hours the following days before hitting limit-up almost immediately on 4 March and 7 March.
Extreme liquidity imbalances are seen with the price limits being hit
Insights gained from BMLL Level 3 Data
Understanding market dynamics and the ability to navigate a vast and rapidly changing data set has never been more critical than now. BMLL is the leading, independent provider of harmonised, Level 3 T+1 data to the capital markets. We offer all market participants, including buy and sell-side institutions, flexible access to the most granular order book data and analytics, to enable accelerated research, optimised trading strategies and the ability to generate alpha at unparalleled speed and scale. Level 3 Data from CME, Eurex and ICE is available to all market participants, covering Equity Indices, Fixed Income, Short-Term Interest Rates, Commodities, Digital Assets/Cryptocurrencies and FX.
Read this article on Tabb Forum